See where real visitors click and how far they scroll.
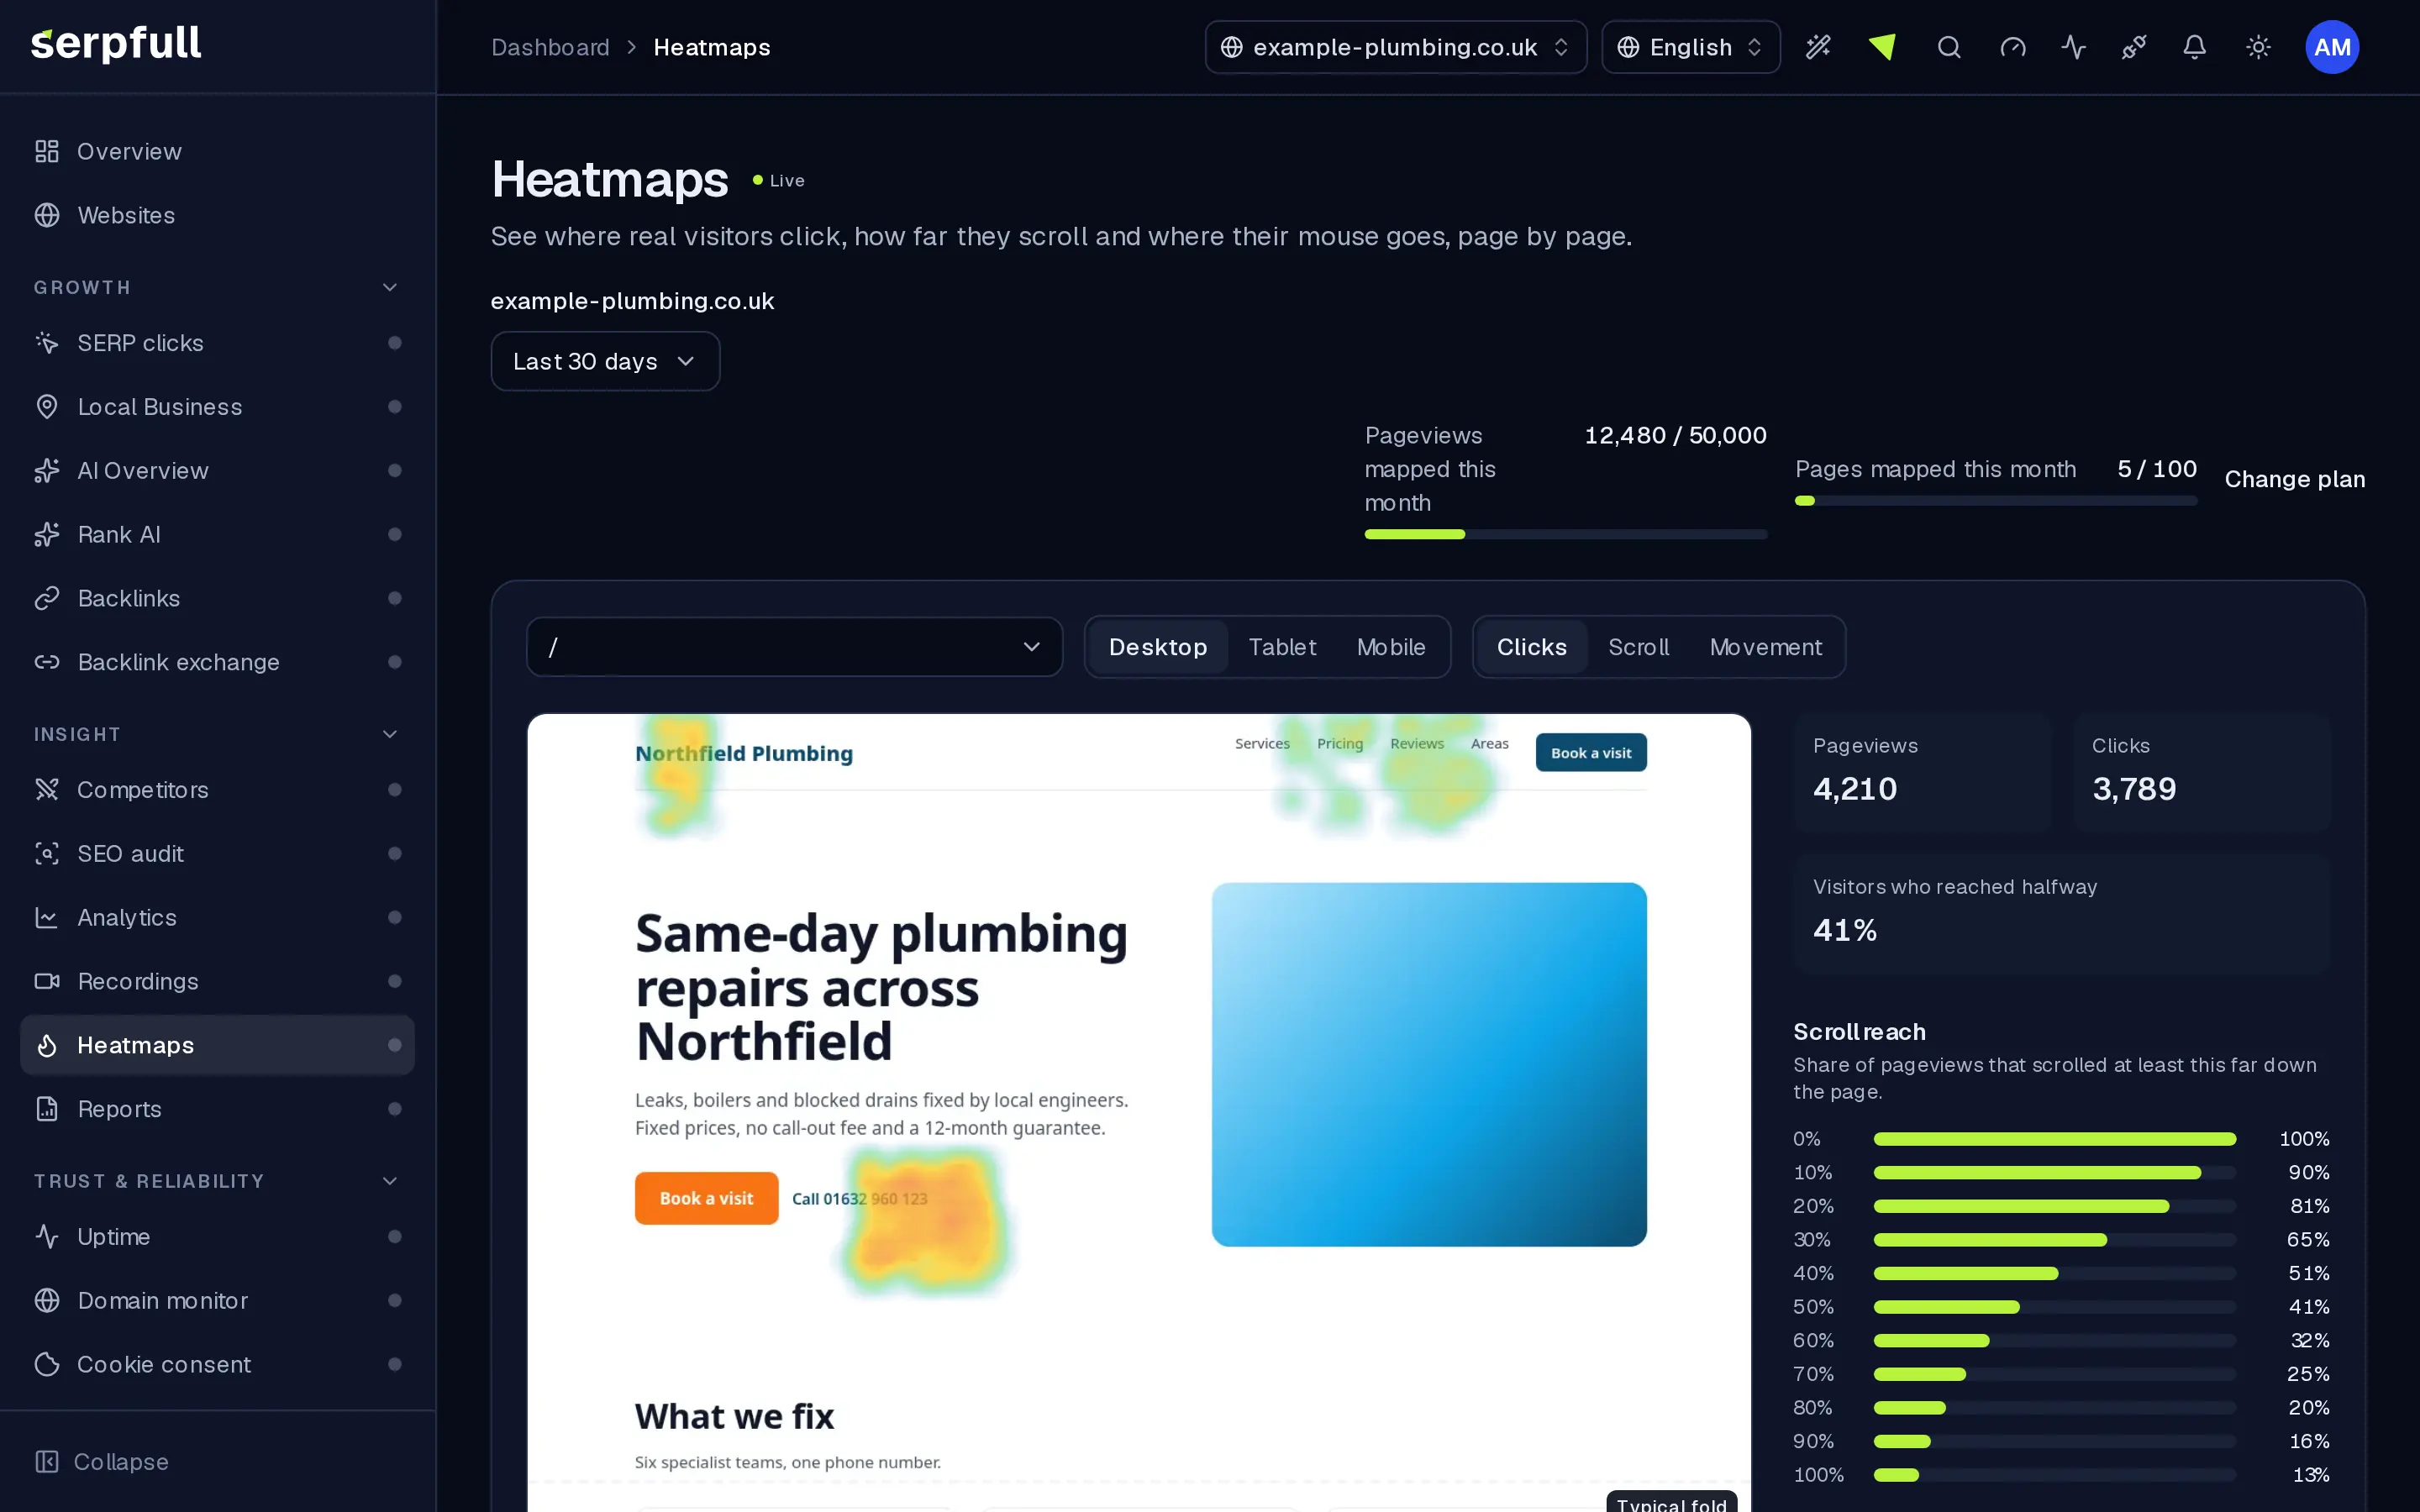
Click, scroll-depth and mouse-movement heatmaps built from real visits, collected by the Analytics snippet you already install. Switch it on per site, pick a page and device, and see the hot spots over your live page.
Em resumo
Heatmaps adds click, scroll and movement maps to the Analytics snippet you already install, with no second tag. Positions are stored as grid counts per page, device and day rather than per visit, and typed values and page text are never collected. Consent and Do Not Track are respected just as in Analytics. Included on every plan, with monthly pageview and page allowances.
Porquê o Heatmaps
Como funciona
Da configuração aos resultados, passo a passo
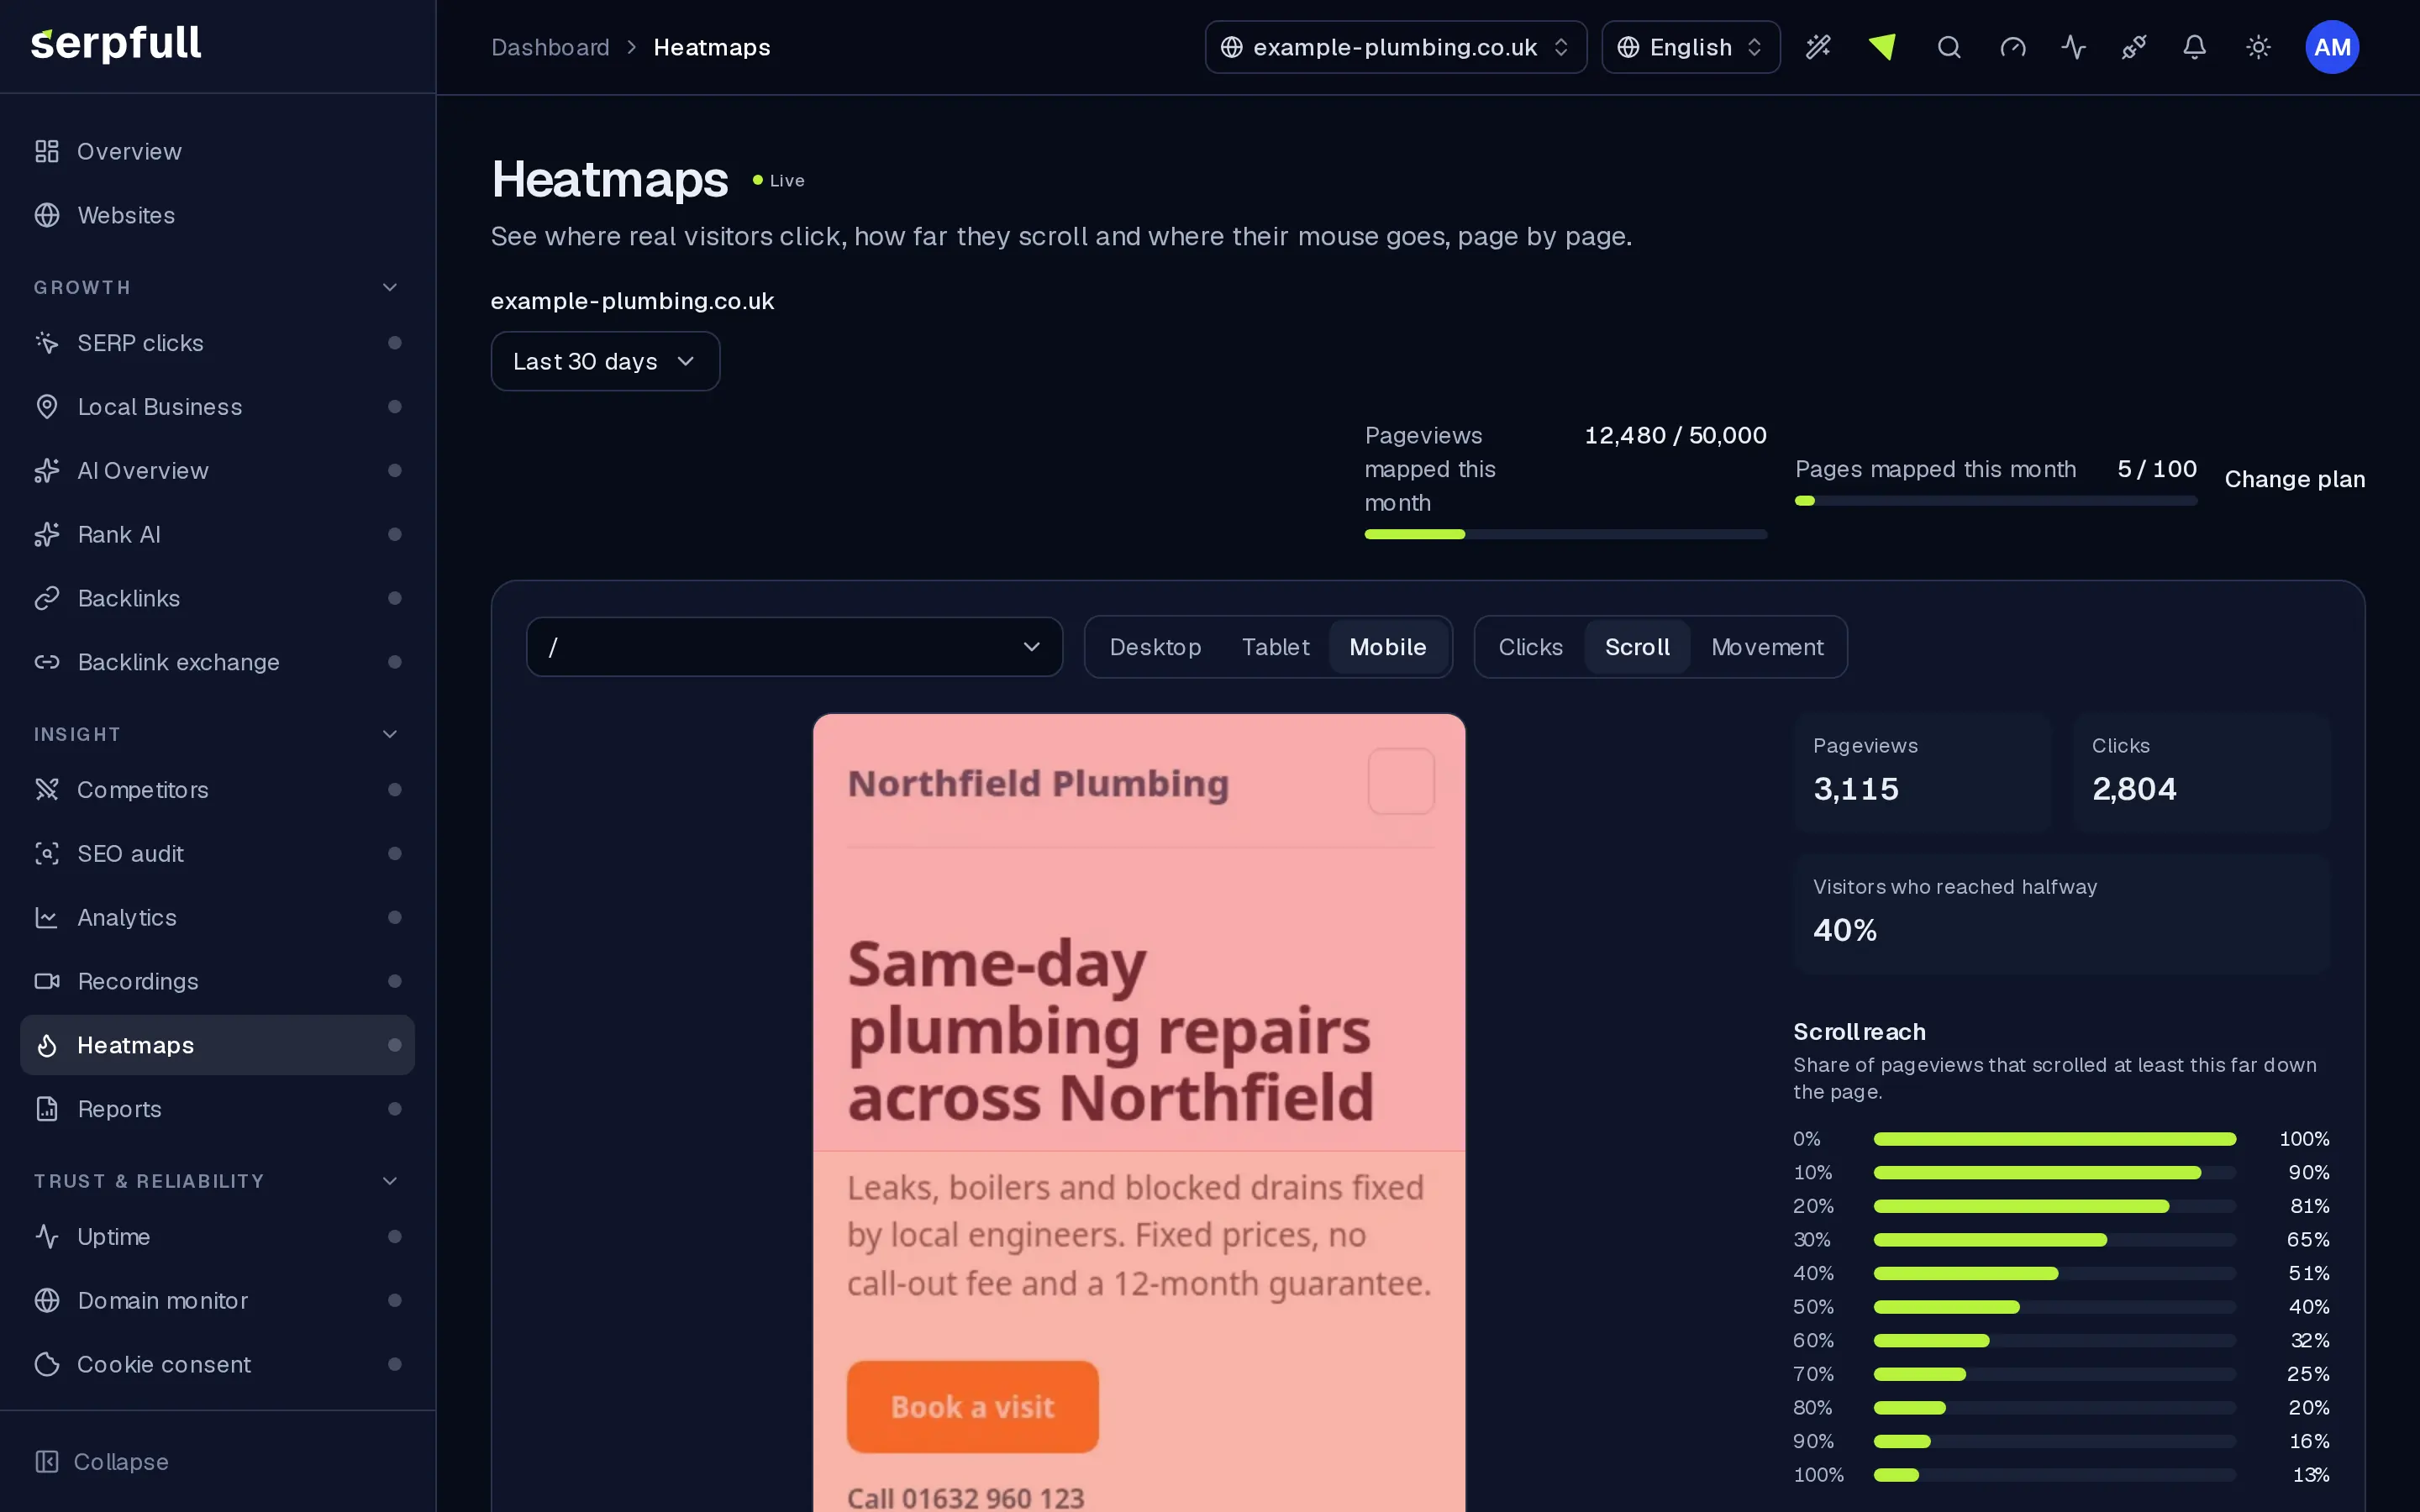
Ecrãs do nosso espaço de demonstração, com dados de exemplo.
- 01
Switch it on
Turn Heatmaps on for a website. The Analytics snippet loads a small collector for visitors who have given analytics consent.
- 02
We count, not record
Clicks, scroll depth and sampled mouse positions are bucketed into a grid per page, device and day. No text or typed values are read.
- 03
Pick a page and device
Choose a page, desktop, tablet or mobile, and a date range. The heat layer is drawn over a fresh snapshot of that page at the same width.
- 04
Act on it
Move key buttons above the fold, cut sections nobody reaches and check the fix in the next week's map.
Características
Dentro de Heatmaps
Clicks, scroll and movement
Switch between click hot spots, a scroll-reach overlay and sampled mouse movement for the same page.
Desktop, tablet and mobile
Every click is bucketed by viewport, so a mobile layout never smears into the desktop map.
Over a snapshot of your page
We capture each mapped page at desktop, tablet and mobile width every week and again when its layout changes, so the heat lines up. Refresh it yourself after a redesign.
Scroll reach and the fold
See what share of visitors reached each part of the page and where the typical fold sits.
Top clicked elements
A ranked list of the buttons and links people click, by their page structure, never their text.
Private by design
Aggregated counts with no per-visit trail. Typed values and page text are never read, and consent and Do Not Track are honoured.
Light on your site
A small collector loads after the analytics snippet for sites with heatmaps on, listens passively and sends tiny batches in the background.
Tours guiados
Um tour guiado mostra o caminho Heatmaps
No painel, clique no ícone da varinha no cabeçalho e escolha o tour Heatmaps, ou selecione “Tour nesta página”. Ele destaca cada parte da página e explica o que faz, passo a passo.
Como funcionam os tours guiadosCasos de uso
Quem usa o Heatmaps
Limites por plano
Heatmaps em cada plano
Os limites aplicam-se por site. Todos os planos incluem o Heatmaps.
| Limite | Starter | Growth | Scale | Pro | Enterprise |
|---|---|---|---|---|---|
| Heatmap pageviews per month | 10 000 | 50 000 | 150 000 | 1 500 000 | 5 000 000 |
| Pages mapped per month | 25 | 100 | 300 | 2000 | 10 000 |
| Heatmap data kept (days) | 30 | 90 | 180 | 365 | 730 |
| Pages with page snapshots | 5 | 15 | 40 | 200 | 500 |
Questões
Heatmaps Perguntas frequentes
Do I need a new snippet?
No. Switch Heatmaps on for a site and the Analytics snippet loads the collector for visitors who have given analytics consent.
What's collected?
Click positions, the deepest point reached on the page, sampled mouse positions and a short structural selector for clicked elements, counted per page, device and day. No text, typed values, cookies or browser storage. Add data-serpfull-block to leave an element out.
Does it respect cookie consent and Do Not Track?
Yes. The collector starts after the same consent and Do Not Track checks as Analytics.
How long is heatmap data kept?
It depends on your website's plan, as shown in the table on this page. Older days are removed automatically.
What if I hit my monthly limit?
We alert you at 80% and 100%. Once you reach it, new pageviews aren't mapped until next month. Analytics keeps working as normal.
Does it slow my site down?
The collector is a few kilobytes, loads after the page for sites with heatmaps on, listens passively and sends small batches in the background.
Where does the page image come from?
We open each mapped page at desktop, tablet and mobile width and save a compressed snapshot, refreshed weekly, when its layout changes and when you press Refresh snapshot. If a site blocks automated browsers, the map falls back to your live page or a neutral outline.
See what visitors actually notice.
Switch on Heatmaps for a website and watch the click and scroll maps fill in from real visits.